✕

Column: industry Tag: hotel performance,Boutique hotel performance,Boutique hotel Published: 2017-12-13 13:38 Source: Author:
HENDERSONVILLE, Tennessee—Rate and revenue-per-available-room growth for boutique hotels might be decelerating, but these high-end hotels still are outpacing comparable non-boutique property performance on an absolute basis, according to data from STR, parent company of Hotel News Now.
STR defines boutique hotels as properties that appeal to guests because of their atypical amenities and room configurations. Boutiques normally have a high average daily rate and often provide authentic cultural, unique historic experiences and interesting guest services. Select boutique chains in the STR database include the Autograph Collection, Dream Hotels, Exclusive Hotels, Joie de Vivre Hotels, Kimpton, Melia Boutique and Rosewood Hotels & Resorts.
This article compares U.S. boutique hotel performance in the luxury, upper-upscale and upscale classes to all other U.S. hotels (“non-boutique”) in the same scales. This data has been compiled on a rolling 12-month moving average basis from January 1990 to October 2017, unless otherwise noted.
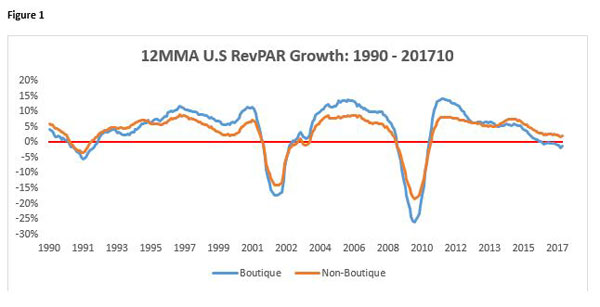
Boutique hotels generally report higher RevPAR growth than non-boutique hotels (Figure 1). The most recent timeframe is an exception, since boutique hotel RevPAR decreased 1.3% to $166.08 while non-boutique RevPAR grew 2.1% to $124.50 as of October 2017.

Boutiques’ outsized RevPAR performance is mostly due to strong average daily rates. Boutique hotel ADR growth surpassed non-boutique ADR growth in 198 of the 334 months we analyzed. Again, the most recent 12-month period provides an exception: Boutique ADR decreased 1.5% compared to a 1.7% increase for non-boutique hotels. However, boutique hotels during this same period achieved $224.88 absolute ADR, which is $52 higher than non-boutique ($172.60) hotels.
Another way to analyze ADR is via performance on compression nights, or when occupancy in a market is 95% or higher. Across all 168 U.S. markets, boutique hotels reported 829 compression nights year-to-date through October 2017 compared to 1,482 compression nights for non-boutique hotels. While boutique hotels reported fewer total compression nights, they achieved higher average rates ($264.02) on compression nights than non-boutique hotels ($210.73).
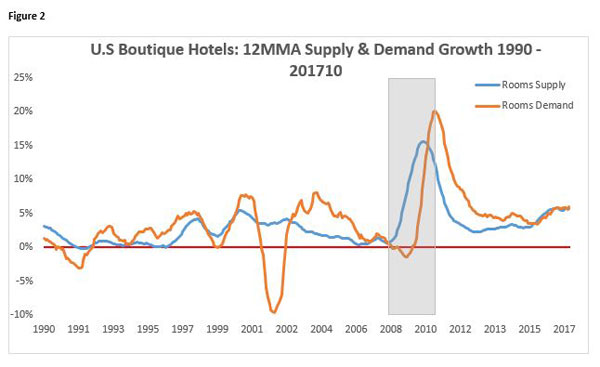
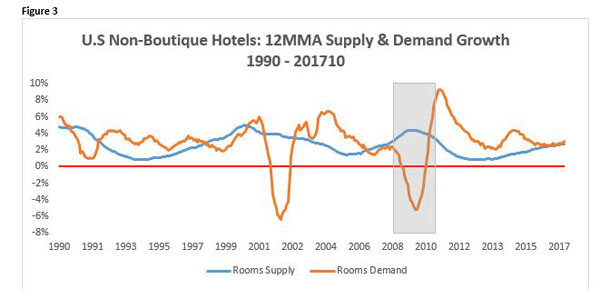
Occupancy between the two data sets trended similarly over time, with periods of variance best explained by analyzing supply and demand (Figures 2 and 3).


Of particular interest is the period following the 2008 global economic crises (shaded region). Boutique hotel demand rebounded faster and more significantly than non-boutique demand. In the 12 months ending October 2017, boutique demand increased 6% compared to 3.1% for non-boutiques. Boutique supply, meanwhile, was up 5.8% compared to 2.7% for non-boutiques.
Boutique hotels grew their share in both supply and demand to 6% during the past seven years (2011-2017) compared to 5% the prior seven years (2003-2010) (Figure 4).

Previous:Sydney Hotel Industry Reports 90.8 Percent Occupancy for November 2017
Next:Art can boost guest experience, rate expectations
Hot key words
Hot Products
Popular Vendors