✕

Column: industry Tag: RevPAR,submarkets,U.S. RevPAR Published: 2017-05-23 17:09 Source: Author:
HENDERSONVILLE, Tennessee—In a previous article, we observed the fluctuations of submarkets with negative revenue per available room percent change and related their count to the total U.S. RevPAR declines.
Clearly, a larger number of submarkets with negative change causes the total U.S. numbers to drop. The obvious question then is: At what exact point does U.S. RevPAR start declining? In other words, what percentage of submarkets has to show declines?before the total U.S. flips?
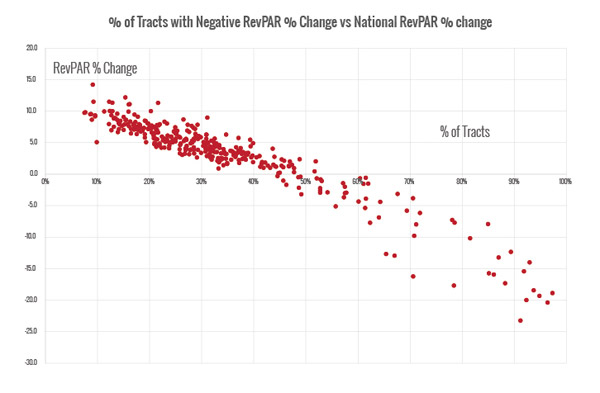
When charting the monthly data of tracts with negative monthly U.S. RevPAR back to 1989, the following trend emerges:

(Source: STR)
There clearly is a linear relationship: The more submarkets report a drop in RevPAR, the larger the U.S. RevPAR decline. A regression analysis shows the tipping point when U.S. RevPAR turns negative is reached when 43.5% of submarkets turn negative. The 95% confidence interval falls between 42.8% and 44.2%.
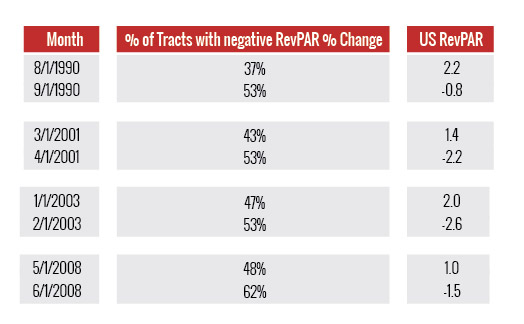
It is interesting to observe the tipping points throughout the lodging cycles. In the following table, we show the count of submarkets for the months right before the U.S. RevPAR declined:

(Source: STR)
So, arguably the writing was on the wall for negative RevPAR since in the last three instances of U.S. RevPAR decline, more than 50% of submarkets reported drops in RevPAR.
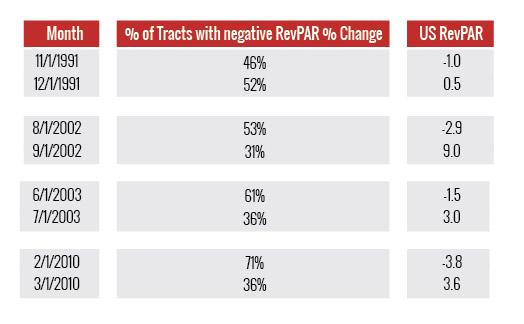
On the other side of the cycle, in an upmarket, more submarkets turned faster and the U.S. data turned.

(Source: STR)
So, as soon as less than 40% of submarkets showed RevPAR declines, the U.S. data turned positive. The 1991 recession is an outlier, when it took more than 50% of submarkets to turn positive before the national data turned.
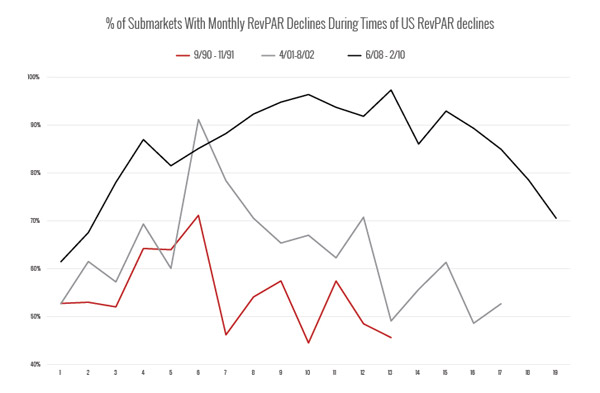
For a different look at the last three recessions, we charted the monthly percent of all submarkets with negative RevPAR during the periods of national RevPAR declines.

(Source: STR)
What is noteworthy is that the last recession and the corresponding RevPAR decline seems to have been felt by many more submarkets than in prior years. Whereas in the 1990s only 70% of submarkets registered a decline at some point, that percentage was in the 90s post-9/11. But during the Great Recession, for 14 months in a row, more than 80% of submarkets reported drops in their RevPAR.
So where do we stand today? In February of this year, 44% of all submarkets showed RevPAR declines and RevPAR in the U.S. still grew 1.2%. March data was obviously more positive because of the Easter shift?(only 10% of submarkets showed RevPAR declines). And in April, RevPAR continued to grow?slightly (+1.7%), but the number of submarkets with negative RevPAR was 49.3%.
If the trend continues and if prior cycles are an indicator of future performance, we are in for a rocky ride.
Previous:Dream Hotel Group Announces Plans to Triple Existing Portfolio by 2022
Next:Brand accountability adapts to new competitiveness
Hot key words
Hot Products
Popular Vendors