✕

Column: industry Tag: hotel supply,US markets,hotel industry Published: 2017-08-21 13:58 Source: Author:
NASHVILLE, Tennessee—With nearly a third of the total room supply in the United States, more than 35% of all rooms sold in the country and approximately 43% of total revenue share, the top 25 markets in the U.S. can be good indicators for the overall health of the hotel industry.
“Some would say, ‘As the top 25 markets go, the rest of the industry could go,’” said Brad Garner, SVP of client services and relationships at STR, who presented during the “Assessing the performance and impact of the top 25 U.S. markets” data dash session at the Hotel Data Conference. STR is parent company of Hotel News Now.
Here are some top takeaways on the 2017 performance of the top 25 markets in the U.S.—as defined by STR—and what to expect from them in the future.
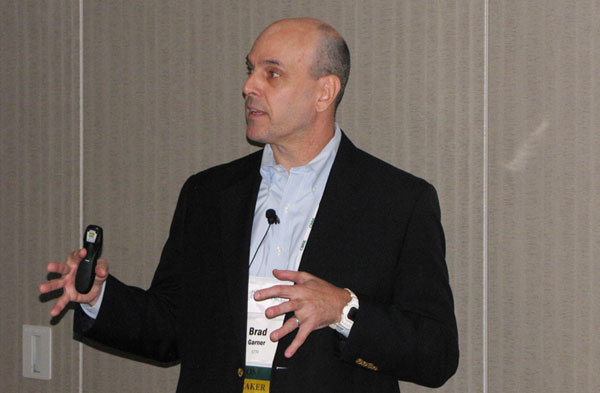
Brad Garner, SVP of client services and relationships at STR, presents during the “Assessing the performance and impact of the top 25 U.S. markets” data dash session during the Hotel Data Conference. (Photo: Dan Kubacki)
Pipeline numbers
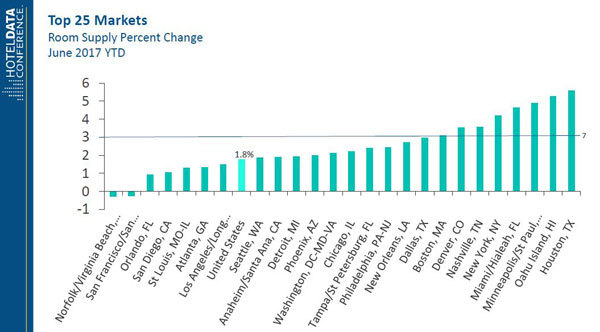
Through June, year-to-date supply growth is 1.8% for the total U.S., and seven of the top 25 markets—Denver; Nashville, Tennessee; New York; Miami/Hialeah, Florida; Minneapolis/St. Paul, Minnesota; Oahu, Hawaii; and Houston—reported more than 3% supply growth during that period.
(Slide: STR)
(Slide: STR)
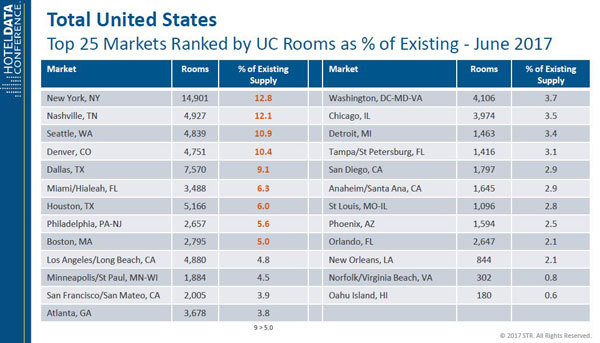
New York (14,901 rooms), Dallas (7,570) and Houston (5,166) led the way with the most rooms in construction as of June. Garner said a total of 45% of all rooms in construction in the total U.S. are concentrated in the top 25 markets, and nine markets have more than 5% of their existing supply waiting in the pipeline, including New York (12.8%), Nashville (12.1%) and Seattle (10.9%).
“I don’t know what that danger is; mileage varies by market in terms of the absorption of those rooms,” Garner said.
Key performance indicators
With hotel development ramping up and new supply coming online, a majority of the top 25 markets reported year-to-date occupancy change below the 0.7% growth notched by the total U.S. Only six markets—New York; San Diego; Detroit; Orlando, Florida; Seattle and Norfolk/Virginia Beach, Virginia—reported year-to-date occupancy growth above the total U.S. occupancy growth through June.
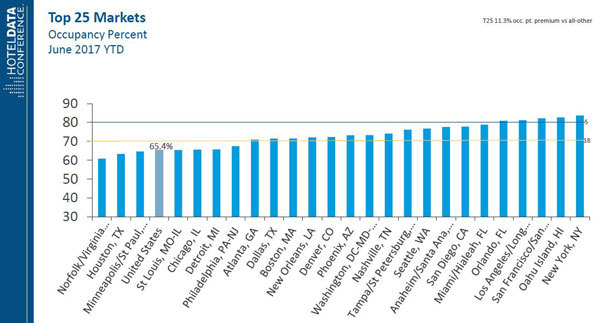
However, Garner noted that the top 25 markets still are posting impressive absolute occupancy numbers, according to June year-to-date data.
(Slide: STR)
“The word I would use is fully compressed,” Garner said. “There’s your national average—65.4%—and 18 of the top 25 markets at 70% or in excess of 70% absolute occupancy, with five markets in excess of 80%, so they’re sold out four of five nights of the week.”
Average daily rate for the total U.S. was reported at $126 through the first six months of the year, and the three highest-ADR markets include New York, Oahu and San Francisco, despite the loss of convention business due to the closing of the Moscone Center.
“Even with what San Francisco is going through with the Moscone Center, they’re still commanding premium rate,” Garner said.
A total of 12 of the top 25 markets reported year-to-date revenue-per-available-room growth higher than the 3% growth reported by the total U.S. Given the increasing supply and near-flat occupancy growth, Garner said it’s important to note where that RevPAR growth is coming from.
“Most of the markets are being driven by the ADR side of that equation,” he said.
Forecasts and markets to watch
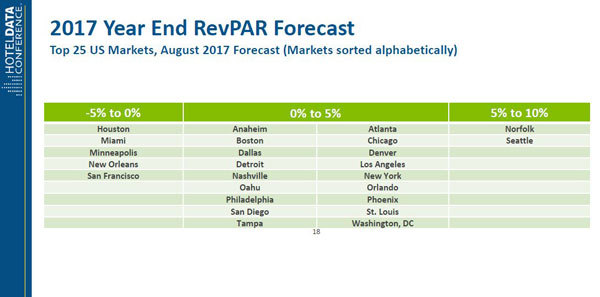
Through the end of the year, STR is forecasting five markets—Houston, Miami, Minneapolis, New Orleans and San Francisco—will see RevPAR between a 5% decrease and flat performance. Norfolk and Seattle, Garner said, should expect 2017 full-year RevPAR growth between 5% and 10%.
(Slide: STR)
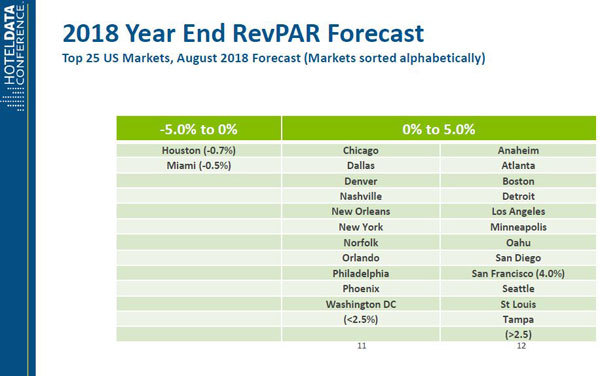
But in 2018, look for San Francisco to have a significant turnaround.
“When Moscone Center comes back on and they get over the Super Bowl comp, they will have a great year next year,” Garner said. “We’re predicting 4% growth in RevPAR for San Francisco.”
(Slide: STR)
During his market grades and awards segment of his presentation, Garner also highlighted Oahu and Las Vegas as markets to watch. Southwest Airlines is increasing the number of flights to Hawaii in 2018, he said, and STR projects 3.4% RevPAR growth for Oahu in 2018.
Las Vegas is getting its first professional sports franchises, starting with the NHL’s Golden Knights for the 2017-18 season and the planned move of the NFL’s Oakland Raiders to Las Vegas by 2019. Garner said STR plans to incorporate Las Vegas and approximately 85,000 rooms—75% of all rooms in the Las Vegas market and 89% of all rooms in the Las Vegas Strip submarket—in its sample soon.
Previous:F&B trends: Catering, banquets lead in revenue growth
Next:Strong Chinese domestic travel lifts China Lodging’s Q2
Hot key words
Hot Products
Popular Vendors